 MapInfo resources available for dam safety applications
- Index List of MapInfo files and data available
for dam safety applications (this file).
- List of MapInfo Frequently Asked Questions, current version
available from
http://www.inmap.co.nz/mi_faq/contents.html
- STATES.TAB A base map for the 48 contiguous
states and the state of Alaska. The STATES.TAB file is included with the MapInfo
3.0 install disk. Gridlines can also be opened using the GRID05.TAB file from MapInfo to
establish 5-degree by 5-degree tiles. These tiles are used to
identify the location of data from the Digital Chart of the
World, color relief maps, etc.
- ST_LOW48.TAB High
resolution state boundary file of lower 48 states; based on
1994 Tiger data that has been translated into MapInfo File Format
(MIF) and placed on the Tiger Home Page
(
http://www.census.gov/tiger/tiger.html).
A compressed file (
51st_mif.zip) with the MIF data is available for users to
download, uncompress with PKZIP.EXE and import into a MapInfo TAB
file.
- COUNTY.TAB Provided by MapInfo Corporation as
a supplemental (low resolution county)
file. It has also been broken down as 48 separate files showing
all counties within each state.
- counties High resolution county files (one for
each state) are available in MapInfo format and included in one
ZIP file (
51co_mif.zip) that can be downloaded from the Tiger Home
Page.
- DCW Translated from 1992 Digital Chart of the
World, using DCW2MIF, a series of 5-degree by 5-degree tiles were
generated showing features such as political
boundaries and rivers one at a time
or together to show all layers in the
same view. Additional layers are also available on the DCW
CD-ROM. USGS provides a
fact sheet describing the Digital Chart of the
World. An updated DCW was scheduled for release in 1995.

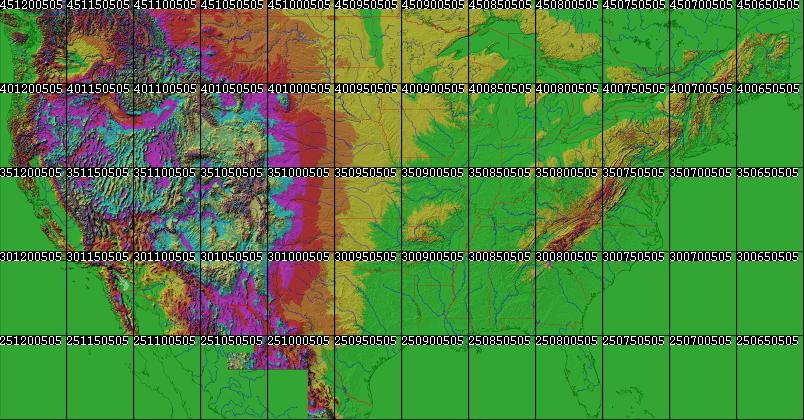
- Relief maps Color
relief maps based on 5-degree by 5-degree tiles. Downloaded
from internet FTP site and saved as a JPG file. The relief maps
can be used as background for a series of vector layers. An Index map(101k) shows the location of each
of the tiles. Source - Johns Hopkins. Political boundaries and rivers(31k) can
also be added to the color relief map. At a little larger scale,
hydro dams(121k) have been added.
These color relief maps can be downloaded from several locations
including
ftp://src.doc.ic.ac.uk/geology/maps/gifmaps and also from the
Color Landform Atlas of the United States.
- Assorted maps 230,000 maps from University of Texas. An example is a county map of Georgia, a raster file with typical bitmap
limitations.
- Montana Raster and vector
maps for Montana, such as river basins, roads,
legislative districts, etc. Some of the files are in ArcInfo
compressed format and must be translated with versoin 3.1 of
ArcLink.
- SUBWATS.PCX Berkeley regional study
SURFACE.PCX
- NID National Inventory of Dams has been
collected for 76,000 dams in the United States. A copy of the
1993-1994 inventory is published on CD-ROM may be obtained from
FEMA. In addition, the Corps of Engineers provides an
on-line copy of the database in three formats including
dBASE. The entire United States or any one state can be opened
in
MapInfo. Operates much faster if only one state is opened rather
than the entire USA.
- FERC_NAT.TAB All FERC regulated dams that are
included in the National Inventory of Dams. The dBASE file was opened in
MapInfo and Points Created.
- SEISMIC.TAB Seismic
zones of the lower 48 states. Weekly seismic data also
available from San Diego Home Page. EQNET.TAB
Seismic networks and data centers in the US EQ9507US.TAB M>2
earthquakes recorded by CNSS network for the 2 weeks ending
7/29/95. NCAL.TAB Northern California earthquakes (7/17/95)
- Weather maps Rainfall intensity available from
several internet sources; including
Michigan State
University and Ohio
State. An example is the rainfall for tropical storm Beryl. Weather forecast maps are also
available from several places such as
INTELLICAST.
- Streamflow Streamflow data that has previously
been available from WATSTORE can now be obtained from the
EarthInfo CD-ROM and exported as a dBASE file (or ASCII, 123,
etc.), alpha-numeric long\lat entry must be converted to decimal,
and opened in MapInfo. For example, this will allow gages and
other resources in an area to be viewed on the same map. Daily
and peak value are both available on the CD-ROM.
- Hurricanes This is a MapInfo (v3) table
storms.zip (696k) of all
Atlantic hurricanes from 1888 to 1995 (including Opal). Tracks
are colored by storm strength, segmented by daily locations.
Great resource for weather wonks, risk managers, planners. etc.
Daily records show fields including Name, Date, Time of
recording, Lat/Long, Wind speed, Pressure, and SaffirSimpson
category. Thanks to Steve Wallace who maintains the Geographic
Jump Station at
http://nervm.nerdc.ufl.edu/~ffbic/index.html .
- USGS flows Through the internet, streamflow data are also
available online from USGS. Output formats include large graphs,
small graphs and tab-delimited text data files. A GIF map,
showing counties and rivers included, such as the one for Georgia
(CNTY.GIF).
- USGS Quads Available from several Internet
sources. The file
QUAD100.GIF is an index map of the 30 by 60 quads in Iowa.
Arc/INFO data files provide
Iowa state-wide coverage.
- Aerial photo Available from several Internet
sources, such as
NASA's Photo Gallery or
Bill Thoen's Web.
They can be used as background for a series of vector files. An
example is SC-WASH.GIF.
- ArcInfo data ArcInfo data can be converted to
MapInfo using the ArcLink program. This program operates
within MapInfo. Iowa is an example of river data that were found
in file rivers01.taz and topo in topo01.taz. data
- STIPPLED.TAB Approximate outline of HMR-51
stippled area.
- DLG The description of
Digital Line Graph data files is provided on the USGS Home
Page. A DLG file can be large (7.5-minute by 7.5-minute units),
intermediate (1:100,000 scale), or National Atlas sectionals of
the United States at 1:2 million scale. An example of a large
scale DLG is the GIF file of Coeue D'Alene.
- DRG Digital Raster Graphic files are scanned
images of USGS topographic maps. The DRG may be used as a
background layer to review or revise other data. More
information may be obtained from the
USGS fact sheet for DRG data. An example of a DRG file is
the quad sheet for the Harrisburg,
Pennsylvania area, that is included on the USGS WWW
server.
- Hydrologic unit maps These maps include a
hydrologic unit map of the United States, and hydrologic unit
maps for each State. They delineate the hydrographic boundaries
of major river basins and show numeric codes assigned to each
river basin.
Hydrologic Unit Maps may be obtained online from the
USGS in Arc/INFO format.
- Street Atlas USA The CD-ROM version of Street
Atlas USA can be used for locating dams or downstream inundation
areas. For any dam site, these maps can be saved as raster files
and opened in MapInfo. Tip: Upon exit from the Street Atlas USA
program, the ST.INI file contains the longitude and latitude of
the center of the last map that was viewed. This is a quick way
to find the longitude and latitude of a location, such as a
damsite.
- US Cities A collection of 25,682 cities and
towns in the United States
usa_city.zip (915k) available in MapInfo format from
the MAPINFI-L FTP Site, (contributed by Steve Wallace). Fields
in the database include state, city name, land area, water area,
Hu100, and 1990 population.
- Atlas A transportation atlas on CD-ROM, also
with waterway information, is available from the Bureau of
Transportation Statistics Office of Geographic Information
Services URL
http://www.bts.gov/gis/ntatlas/ntad.html or by calling phone
number 202-554-3564 or 366-DATA.
Return to Ron Spath's Home Page
Please send any comments to
rspath@access.digex.net.
Last revised December 27, 1996

